It’s a bull market? But 70% of companies are down!

This week, the AFR published an article that touted the claim that, at least in 2024, the ASX is a “winner takes all” environment.
Within the article, it argues that, with the recent flatlining of ASX200 stocks, the small cap market has no chance of a revival.
Or in other words, “the ASX200 is flagging, which means the rest of the market has no hope”.
This got me thinking, how much of the market’s perception, and therefore expectations, is set by the performance of the ASX200?
To answer this question, we ran the numbers and came up with a surprising insight.
There are six categories of public companies.
A common way markets are categorised is via market cap: mega caps, large caps, mid caps, small caps, micro caps, and nano caps (not everyone includes micro caps or nano caps but, as you will see, it is an important distinction).
I’ve broken down the definitions and distribution of these companies across the ASX:
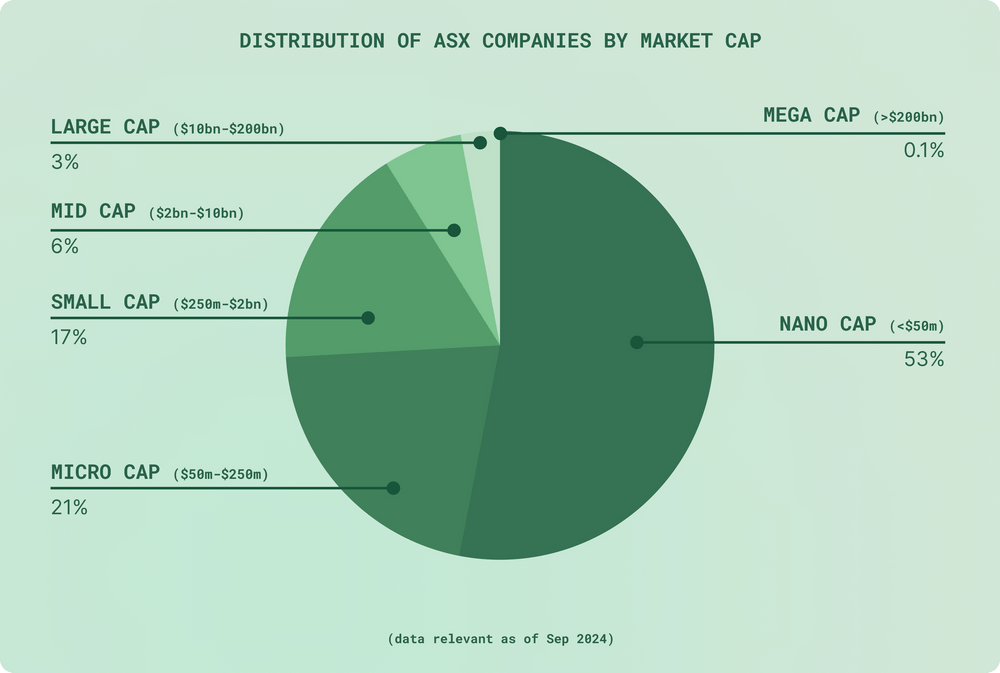
What is immediately obvious is that the vast majority of companies are at the small end of the spectrum, whilst the top end of town is thin.
But go to afr.com/companies on any given day, and you can bet that at least 5 out of 6 ‘companies in the news’ are in the ASX100.
And that 6th company (listed as “small ords”) still resides in the ASX300.
This is problematic because, in effect, sentiment in public markets is mostly influenced by major mastheads like the AFR and major mastheads only cover the top ~15% of listed companies…
These companies are very different from the rest of the ASX: they are more mature, they have more resources, and they present a very different investment case.
This coverage also presents a flywheel effect, with mastheads a reliable channel for major companies to communicate with the market, which in turn ensures that these companies can get their message across to investors.
As one CEO said to me at one of our community dinners last year, “there is nothing in common between being the CEO of an ASX200 company and being the CEO of a micro cap.”
In other words, ASX200 companies have a channel to market communication that is not available to the rest of their listed peers.
“So what, Ben? This isn’t exactly news to me.”
A major masthead is always going to provide coverage of companies that have appeal to as large an audience as possible. Also, these companies represent over 80% of the market’s combined market cap - why shouldn’t the major outlets focus on these companies? If I ran the AFR, I might employ the same strategy.
But my point here is that major mastheads heavily influence investors’ perceptions, and therefore their expectations, of the market. If your company sits outside the ASX200, then your investors expectations are influenced by companies that are in no way similar to yours.
To illustrate my point, let’s look at the same distribution of ASX companies as before, but this time we will include the median share price performance over the past year:
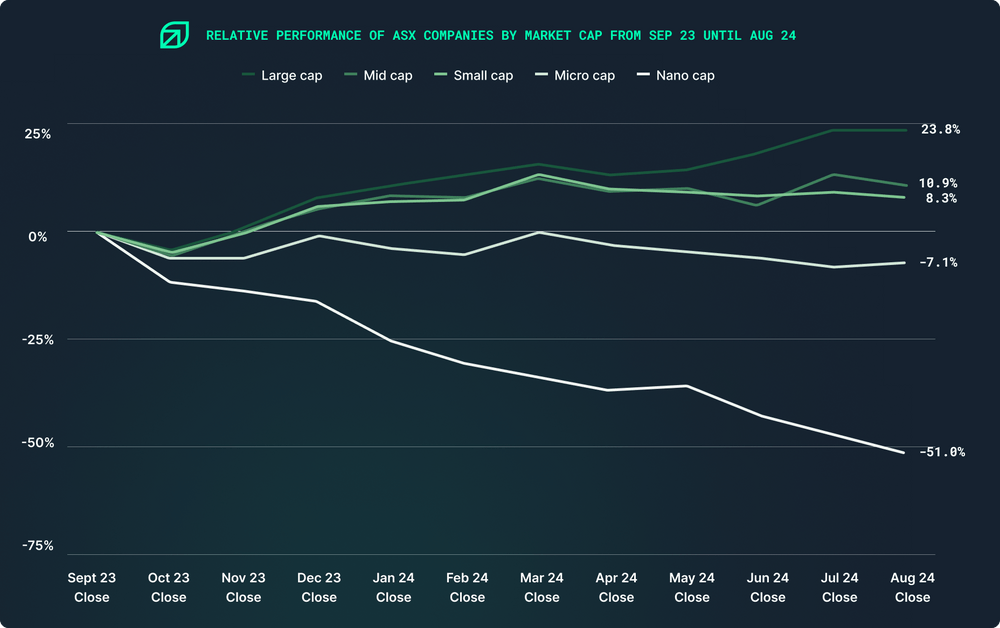
Perceptions and reality are not the same. According to most mastheads, we’ve been in a bull market - but 70% of listed companies are down for the year.
To recap: the market’s expectations, and therefore sentiment, is unfairly influenced by the ASX200.
For any company that is below $250m in market cap, you are fighting a “David vs. Goliath” battle with your larger peers. The battleground? Your shareholders’ minds.
Consider this: imagine you are a $40m market cap company (i.e. the median market cap) and your share price is down 20% for the year. Relative to your peers, you have had a good year - 30% better than the median in your category!
But most shareholders’ perceptions are heavily influenced by major mastheads. When they’re looking at your share price, they think that you’re underperforming by at least 30%.
So in this scenario, you’re outperforming your peers by 30%, but the market thinks you’re underperforming by at least 30%!
So besides the fact that no-one likes to be down at all, what impact would that have on your capital?
- If you need to raise capital, you might have to discount heavily.
- If you need votes, you might have some upset shareholders to win over.
- If you need new shareholders or liquidity, it might be tough.
In short - there aren’t many impressive 12 month charts out there, especially when people are conditioned to making money. Your last 12 months of market performance is done, you can’t change that.
But load up your code in a trading app. Have a look at it vs the averages above. Get a sense of your relative performance (how is it by the way?) and make a plan to either (1) highlight your overperformance, or (2) shift into the next gear.